You were looking for what? (Or, search term questions.) October 26, 2017
Posted by tomflesher in Macro, Teaching.Tags: CPI, Reader questions
1 comment so far
Occasionally I mine the search terms for interesting questions. Here are three from the past month:
- What is an increase in CPI?
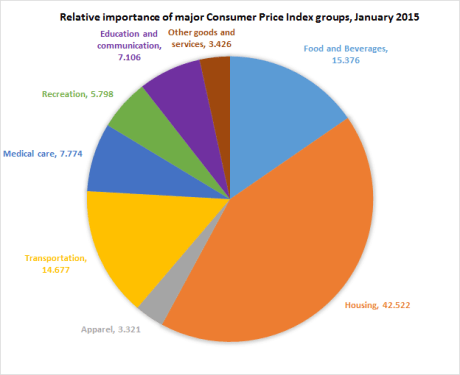 When a country’s CPI increases, that means that, on average, the cost of living in the country has increased. The Consumer Price Index measures the price of a fixed basket of goods. For example, in the United States, CPI consists largely of housing costs, food and beverages, and transportation. When the price of any good in the basket goes up, it increases total basket expenditure, but the effects of (for example) increasing food costs would be greater than the effects of increasing costs of haircuts (included in the “Other” category). Although the BLS is careful to point out that the CPI is not a cost-of-living index, it functions a lot like one. (The chart was retrieved from the US Department of Labor website.)
The percentage change in CPI, otherwise called the CPI growth rate, is the most common measure of inflation.
- if the cpi went up why not all the goods prices goes up? [sic]
This question gets the causation backwards. The CPI measures how much prices are changing; you can use the percentage change in CPI to measure how much, on average, prices have gone up, but that says very little about individual goods. For example, the Transportation category includes the price of gasoline. If cell phone bills decreased, but gasoline prices increased, the fact that we (on average) spend more money per year on gasoline than on phone bills (as reflected by the different weights, above) means that the gas price increase will have a greater effect on our overall spending.
CPI reflects those changes. It’s possible for the total cost of the basket of goods used to measure CPI to increase even if some of those goods had steady or even decreasing prices.
- mastovesion is good or bad
You do you, gentle reader.
Increases in CPI: Good or bad? January 30, 2012
Posted by tomflesher in Macro, Teaching.Tags: Consumer Price Index, CPI, economics, Inflation, macroeconomics, Reader questions
7 comments
One of the nice things about WordPress is that I get a nice summary of the search engine terms that led people to my page. Bobby Bonilla is popular, as always – it’s nice to know that people are curious about him – but another common way people end up on my blog is by looking for pros and cons of the Consumer Price Index. One searcher this week asked:
Is an increase in CPI good or bad?
As with all economics, the answer is, “It depends,” but let’s start by asking a refining question: Good or bad for whom?
- The Government: Good.
An increase in the CPI represents an increasing cost of living, which is related to inflation. Inflation, as measured by an increase in the CPI, means that the government can sign contracts to pay employees or purchase materials in current dollars and then pay them back in inflated dollars; that is, if I sign a contract today, January 30, 2012, to pay you $100 on January 30, 2013, then the $100 I have now is worth more than the $100 I’ll pay you back with. (This is one reason for interest payments.) Of course, if everyone expects the inflation, they’ll take that into account when contracting with the government and demand higher payments. A government can, in fact, use large unexpected inflation to cut their costs this way – it’s called an inflation tax, and we’ll talk about it a little later on – but it’s not a strategy that works well or often.
- Businesses: Good.
Businesses can take a beating if they’re contracting with governments, but consider wage contracts – when I worked at a factory, pay rates were set by position in January, so my only hope of getting a raise was to move to a higher position. If CPI rose over the course of the year, which it almost always did, I took what was effectively a pay cut until the next round of cost-of-living adjustments in January. That means that the business could negotiate contracts throughout the year for supplies and sales, but its real wage expenses actually fell.
- Consumers: Bad (mostly).
And who takes the brunt of the drop in real wages? Households, or consumers. Since I lack the power to demand my wages rise throughout the course of the year, then my wages on January 1 are going to buy fewer goods than my wages on December 31, even though they’re nominally the same amount of money.
On the other hand, a small, predictable amount of inflation allows for a few things to happen. If it’s small, it means that prices more or less stay the same. (A large inflation rate would make it impossible for me to keep the same wage from January 1 to December 31 without built-in monthly or quarterly raises, for example.) If it’s predictable, we avoid a couple of ugly problems like the inflation tax or surprises when repaying loans. If it’s inflation, rather than deflation, people and businesses have a smaller incentive to hold on to their money to wait for prices to drop, so there’s an argument, weak though it is, to be made that inflation encourages spending.
All told, an increase in CPI means that a household has to spend more dollars to maintain the same standard of living; that’s mostly bad for the households, but it can be good for businesses and the government.
Bobby Bonilla’s Deferred Deal: A Case Study August 2, 2011
Posted by tomflesher in Finance, Macro, Teaching.Tags: annuity formula, Bobby Bonilla, compound interest, CPI, finance, macro, macroeconomics, teaching
4 comments
Note: This is something of a cross-post from The World’s Worst Sports Blog. The data used are the same, but I’m focusing on different ideas here.
In 1999, the Mets owed outfielder/first baseman Bobby Bonilla $5.9 million dollars. They wanted to be rid of Bonilla, who was a bit of a schmoe, but they couldn’t afford to both give him his $5.9 million in the form of a buyout and meet payroll for the next year. No problem! The Mets sat down with Bonilla and arranged a three-part deal:
- The Mets don’t have to pay Bonilla until 2011.
- Starting in 2011, Bonilla will receive the value of the $5.9 million as an annuity in 25 annual installments.
- The interest rate is 8%.
Let’s analyze the issues here.
First of all, the ten-year moratorium on payment means that the Mets have use of the money, but they can tre at it as a deposit account. They know they need to pay Bonilla a certain amount in 2011, but they can do whatever they want until then. In their case, they used it to pay free agents and other payroll expenses. In exchange for not collecting money he was owed, Bonilla asked the Mets to pay him a premium on his money. At the time, the prime rate was 8.5%, so the Mets agreed to pay Bonilla 8% annual interest on his money. That means that Bonilla’s money earned compound interest annually. After one year, his $5.9 million was worth (5,900,000)*(1.08) = $6,372,000. Then, in the second year, he earned 8% interest on the whole $6,372,000, so after two years, his money was worth (6,372,000)*(1.08) = (5,900,000)*(1.08)*(1.08) = $6,881,760. Consequently, after ten years, Bonilla’s money was worth

The prime rate didn’t stay at 8.5%, of course, as the Federal Reserve Economic Data (FRED) webpage maintained by the St. Louis Fed shows. This is a monthly time series of prime rates, which are graphed to the right. The prime rate can be pretty volatile, so it was a bit of an odd choice to lock in a rate that would be effective for 35 years. As it turns out, the prime rate fluctuated quite a bit. Taking the annualized prime rate by dividing each monthly rate by 12 and adding them together, we can trace how much a bank account paying the full prime rate would have paid Bonilla:

So since his agreement with the Mets paid him $12,737,657.48 and he could have invested that money by himself to earn around $10,891,903.26, Bonilla is already better off to the tune of (12737657.48 – 10891903.26) or about 1.85 million.
In addition, we can measure the purchasing power of Bonilla’s money. Using FRED’s Consumer Price Index data, the CPI on January 1, 2000, was 169.3. On January 1, 2011, it was 221.062. that means the change in CPI was

So, the cost of living went up (for urban consumers) by 30.57% (or, equivalently, absolute inflation was 30.57% for an annualized rate of around 3%). That means that if the value of Bonilla’s money earned a real return of 30.57% or more, he’s better off than he would have been had he taken the money at the time.
Bonilla’s money increased by

Bonilla’s money overshot inflation considerably – not surprising, since inflation generally runs around 3-4%. That means that if Real return = Nominal return – Inflation, Bonilla’s return was

Because Bonilla’s interest rate was so high, he earned quite a bit of real return on his money – 85% or so over ten years.
Bonilla’s annuity agreement just means that the amount of money he holds now will be invested and he’ll receive a certain number of yearly payments – here, 25 – of an equal amount that will exhaust the value of the money. The same 8% interest rate, which is laughable now that the prime rate is 3.25%, is in play.
In general, an annuity can be expressed using a couple of parameters. Assuming you don’t want any money left over, you can set the present value equal to the sum of the discounted series of payments. That equates to the formula:
![PV = PMT \times [\frac{1 - \frac{1}{(1 + r)^t}}{r}] \\ 12737657.48 = PMT \times [\frac{1 - \frac{1}{(1.08)^25}}{.08}] \\ PMT = 1193248.20](https://s0.wp.com/latex.php?latex=PV+%3D+PMT+%5Ctimes+%5B%5Cfrac%7B1+-+%5Cfrac%7B1%7D%7B%281+%2B+r%29%5Et%7D%7D%7Br%7D%5D+%5C%5C++12737657.48+%3D+PMT+%5Ctimes+%5B%5Cfrac%7B1+-+%5Cfrac%7B1%7D%7B%281.08%29%5E25%7D%7D%7B.08%7D%5D+%5C%5C++PMT+%3D+1193248.20&bg=ffffff&fg=666666&s=0&c=20201002)
where PV is the present value of the annuity, PMT is the yearly payment, r is the effective interest rate, and t is the number of payments. Bonilla will receive $1,193,248.20 every year for 25 years from the Mets. It’s a nice little income stream for him, and barring a major change in interest rates, it’s one he couldn’t have done by himself.
Shortcomings of CPI March 14, 2011
Posted by tomflesher in Macro, Teaching.Tags: Consumer Price Index, CPI, economics, Inflation, Introduction to Macroeconomics, macroeconomics, Principles of Macroeconomics, substitution bias
add a comment
In the previous post, we talked about the Consumer Price Index (CPI). Basically, the CPI is a number that indicates how much the price of a basket of goods purchased by the typical consumer has changed since a base year we choose when we calculate it. To review, in the base year, CPI is always 100, and in other years a number greater than 100 indicates that prices are higher than the base year while a number less than 100 indicates that the price level is lower than the base year.
One way to measure inflation is just by calculating the change in CPI. The percentage change in CPI – 

However, the nature of the CPI leads to a few problems. They stem from the use of the basket of goods, which has to stay constant from one year to another in order for the comparisons to be meaningful. That means that whatever we decide to use as the basket of goods in 2007 has to be what we calculate the value of in 2011. There are some immediate problems that come to mind.
First, think about the changes in relative prices of goods to each other. Let’s say the basket contains a pound of flank steak. A lot of people use that as the filling for tacos, so a substitute good might be roast pork. If those goods are around the same price, people are indifferent between them. What if the price of pork increases a little, but the price of flank doubles? In that case, a lot of people will stop buying flank steak and switch over to pork instead. The basket doesn’t reflect this, though, so the CPI will rise a lot more than the relative cost of living does, so the CPI doesn’t really accurately reflect the change in the cost of buying what a typical household buys. This is called substitution bias.
Second, I’m addicted to my iPad. When the current basket was created in 2007, it didn’t exist. Now, it’s practically a requirement for a grad student. The basket can’t account for the introduction of new goods like this, since in order for it to be a useful comparison, the basket has to stay the same from year to year.
Finally, I think it’s fair to say that some goods are getting more durable. An iPod Touch, for example, lasts longer than it did when it was introduced in 2007. It offers more features than it used to (such as voice control and a camera). Even if prices had stayed the same, fourth-generation Touch is worth far more than a first-generation Touch. The same expenditure generates a lot more happiness, and so the quality of goods isn’t accounted for in the CPI.
CPI isn’t a perfect measure of inflation or the cost of living, but it’s a common and important one. Know how to calculate it, and know its shortcomings.
What Good is the Consumer Price Index, Anyway? March 14, 2011
Posted by tomflesher in Macro, Teaching.Tags: Consumer Price Index, CPI, economics, Inflation, Introduction to Macroeconomics, macroeconomics, Principles of Macroeconomics
add a comment
One of the first things people learn in their Intro Macro course is that prices change. Before we get into why that happens, let’s think about one of the other things we’ve already talked about: purchasing power and the associated concept, purchasing power parity. One way to measure purchasing power is to look at how much a dollar buys, but in my Beerflation post I referred to how the relative price of beer may have increased since the 70s but the relative price of laptops has decreased. So, let’s consider how we can solve that problem.
One common way to do so is to consider not the price of one good, like a beer at a bar or a can of black beans or a copy of Introduction to Modern Economic Growth, but the overall price of many goods. Think about, for example, the hypothetical cost of being a new college student. I’ll ignore tuition for now (since that’s variable based on where you go to school and how you did in high school) and only consider things a typical freshman would need to buy over the course of the year.
First, the student needs a place to sleep and food to eat. At my current employer, the University at Buffalo, a double room costs $5928. A meal plan with 14 meals per week plus $300 in flexible spending costs $1950 per semester or $3900 for the year. Then, the student needs clothes to wear. A typical wardrobe might be five pairs of jeans, five t-shirts, five polo shirts, ten pairs of underwear, ten pairs of socks, and a winter jacket. If purchased at Target, Wal-Mart and Old Navy, this would run a total of about $250.
As for actual academic expenses, the student will need books for about eight to ten classes (let’s settle on 9 for now). Assuming the price of books is around $80 each (allowing for a class or two that has a novel as the assigned text and two math classes that might use the same book, like Calculus I-II), that puts book expenditure around $720. The Calculus class probably allows the use of a graphing calculator, which currently runs about $100 at Amazon.
Finally, the biggie will be the student’s computer. I tend to go cheap and pick up laptops around $450 from Best Buy, so let’s use that number.
If we add up all of these numbers, we get $11,348, which is a fair number to use when we discuss “the out-of-pocket cost of being a college student.”1 Then, we can compare the cost to last year’s rates and next year’s rates and look at how the out-of-pocket cost of being a college student changes from year to year.
That’s basically what the CPI does. It looks at what’s called in technical terms a “basket of goods.” That is, it assumes that people buy more or less the same goods every year and then looks at the changes in the total price of those goods.2 In order to make things easier to deal with, they perform a mathematical trick called normalizing. That allows us to use an index, or a single number, to show changes. It’s easier remembering that CPI in the base year is defined as 100 than trying to remember what a particular year’s total cost was. They choose a base year and divide that total cost for the basket of goods by the base year’s total cost. So, the formula for CPI in a given year is

So, there are two things to note here. The first is that when the current cost equals the base cost, the CPI will equal 100 (so, CPI is always 100 in the base year). The second is that we can find the approximate percentage change in prices – that is, the approximate level of inflation – using either of the following formulas:

So, summing up, the Consumer Price Index (CPI) is a number that represents how the price of a certain basket of goods has changed since a chosen base year. The basket of goods is meant to represent typical products purchased by a typical household in a given year. It’s one way to measure inflation, since the goods are the same from year to year so the real value should stay the same even if the prices change.
Notes.
1 Note that this is explicitly the out-of-pocket cost. The opportunity cost is much different and would have to take into account the wages that the student gave up to go to college, but wouldn’t necessarily take into account a computer or clothing since those would need to be bought anyway. Again, this cost is an estimate and many of the numbers are estimated or rounded. If anyone cites this as “the cost of going to college,” I’ll be very sad.
2 If we have a model economy where we know that we have a well-defined basket of goods x1, x2, …, xn with associated prices p1, p2, …, pn, then the price of the basket would be

