Equilibrium in Macroeconomics April 22, 2011
Posted by tomflesher in Macro, Teaching.Tags: aggregate demand, aggregate supply, equilibrium, GDP, Introduction to Macroeconomics, macro, macroeconomics, Principles of Macroeconomics, production
add a comment
One of the things macroeconomists focus on quite a bit is calculating equilibrium conditions, or equilibria. Sometimes these account for random shocks or long-term growth – these have names like Dynamic stochastic general equilibrium and they’re outside the scope of this blog, which has so far focused on introductory-level material. We’re going to develop an idea of what an equilibrium is supposed to be and show how to figure out an equilibrium in a simple, open macroeconomy.
Equilibrium has a connotation of balance. The idea is that two (or more) things need to be balanced for some definition of balance that makes sense in the discussion. In economics, we generally think of equilibrium as representing a point where everything that’s produced is consumed. In a market for an individual good, that means we need to find a point where enough of those goods are produced so that everyone who wants to buy a good can do so.
That’s not very exact, though – it’s very rare that we see a goods market where everyone who wants the good can get it. There has to be some sort of incentive for the item to be produced, and generally that isn’t the satisfaction of seeing people using your trinket. (Sometimes it is – for example, the satisfaction of producing this blog and the fact that it forces me to think clearly are incentives for me to produce.) In general, that incentive is a price for the good – by producing, you get the opportunity to sell the good and get some money in exchange. That also provides a mechanism by which people self-select whether or not they participate in the market – at a certain price, people are willing to buy if they value the product at least that much. If the price is too high, they might still want the item, but they aren’t willing to pay for it so they’re no worse off.
How does that generalize to a macroeconomy, where we’re concerned about lots of goods and lots of prices? Well, it can be difficult to do so. That’s part of what makes grad macro so difficult. We, however, are going to make a couple of simplifying assumptions.
First of all, think back to the idea of the GDP Factory, where everyone works. Instead of producing individual goods, imagine that everyone just produces Stuff. The Stuff goes out on the market and is sold for money, the money is used to pay workers, and the workers go back to work and produce more Stuff. So, we can think of all goods as being part of the larger concept of production. So, everything we produce is supplied to the market. Remember that the supply equation is
where 
Then, remember that all the Stuff we produce has to be bought, stored in inventory, or exported, so our demand equation is

where 
In order to find an equilibrium, we need to make another pair of assumptions:
- The more you can sell for, the more you want to produce.
- The more goods cost, the less you’ll want to buy.1
Since we’re simplifying away from individual goods, instead of a price, think about the price level of the economy as a whole (which we’ll abbreviate as PL). Also since we’re not thinking too much about individual goods, we don’t have to worry too much about changes in relative prices. (We can talk about those a little bit later.) So, basically, we’re looking at things statically – we don’t need to figure out what happens if coffee’s price goes up more than tea, for example.
The price level determines, on average, how much Stuff sells for. As the price level increases, we’ll produce more. As the price level decreases, we’ll buy less. There’s just one more condition we need to allow an equilibrium:
- At 0 production, we need an incentive to produce more. So, at 0 production, demand is greater than 0 and supply is 0 by definition. At infinite production, demand is less than infinite.
So, these conditions say 2 things: At a low level of production, demand outstrips supply. As the price level increases, we produce more and demand less. These conditions guarantee that there’s a price level at which we’ll want to supply exactly as much as we want to demand – a little bit lower in price and more will be demanded than produced, and a little bit higher and more will be produced than demanded. So, at that price level,

Supply equals demand.
Equilibrium.
1Mathematically,


Don’t Make A Production About GDP April 11, 2011
Posted by tomflesher in Macro, Teaching.Tags: growth, Introduction to Macroeconomics, macro, macroeconomics, Principles of Macroeconomics, production, productivity
add a comment
I’ve often heard people complain that economics growth models assume that the economy can grow infinitely. Some of these arguments sound plausible – what happens when we run out of resources? – but others seem to fall into the fallacy that wealth exists and is spread around, rather than created. The title of this post – Where does growth come from? – might well be restated as, “How is wealth created?”
To answer that question, think back to how electricity is produced. There’s a small amount of input electricity that’s required to produce any extra electricity, along with natural resources like coal and water to produce steam. It’s possible to recapture some of the electricity produced and use it as input in the next procedure. Note that this doesn’t imply there’s some sort of perpetual motion machine or a finite amount of electricity being used to produce an infinite amount, just that sometimes you need to use a small amount of the final product to prepare more of it. In that case, we could say that the amount of electricity produced is a function of the inputs, which are coal, water, land to produce the plant, and electricity.
In the same way, businesses produce goods and services. There’s a fancy term for production. It’s … production. You can also think of production as real GDP, which is equivalent to the amount of stuff produced in a certain division. Generally GDP will be production within a country over the course of one year.
The input factors for production can be a couple of things. First of all, you need money, but what do you use the money for? Generally, companies use money to buy one of a couple of different things.
- A factory, for example, requires machinery. Even offices need machinery, like copiers and printers. That’s called capital (more properly, physical capital) and (because Marx wrote Das Kapital in German) abbreviated K.
- Any company needs well-trained people who have skills and can operate the machinery or perform services. That’s called human capital and abbreviated H. Human capital is, at the broadest level, synonymous with special skills or (especially) education. It refers to talent or skill, not to the people themselves.
- Companies need to know how to produce whatever it is they produce. This is called technological knowledge and abbreviated with the letter A or occasionally z. Technological knowledge allows everyone to be more productive.
- Companies need natural resources, abbreviated N, to operate their machinery or keep their employees comfortable.
- Finally, companies need people to do the work. This is called labor and abbreviated L.
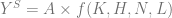
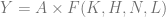
There are many ways to express this relationship. The broadest is to say that we can put a bunch of machines and raw materials in a room with some laborers, some people who have special talent, and the energy to run them, and the people will produce something. How much they produce is a function of how much of each of those factors of production is available, and then there will be a bonus for extra technological knowledge that represents what level of production our factory was already at. We can express that mathematically, using Y to represent output as usual, as
This represents all of the production of our factory or country. We could, then, figure out how much we’re producing per worker. This has a special name: productivity. We can represent productivity mathematically simply by dividing each factor through by the number of workers (which is the exact plain-sense meaning of “production per worker”):

(This requires an assumption called constant returns to scale, which is in turn related to the assumption that when we produce, we produce at around an optimal point where we’re as efficient as we can be given our current level of technology.)
Basically, we produce goods, which are a form of capital. To do so, we use capital and natural resources, which can be used up, along with technological knowledge, labor, and the special skills and talents we call human capital, none of which are used up. Any economy can continue to grow as long as it continues to operate efficiently. That means, as we mentioned in the Comparative Advantage entry, that a country like the US, which has easy access to capital and human capital, should produce things that make the best use of those factors. China, on the other hand, is best off producing labor-intensive goods. India is spread thin with respect to natural resources but has a lot of labor and a lot of human capital.
The key here is that we may see changes in what a country produces over time, but growth can continue indefinitely, as long as we make good choices about production.
